
Case study · Mining — diamonds
Trans Hex
Group
From a weeks-long report to one click
One integrated management report for a diamond mine — plant, mining, finance, security and people — available on demand instead of weeks later.
Delivered 2017; a second version followed
Project overview
Project snapshot
Responsibilities and status, stated plainly. Where the record is silent — a date, a measured result — the page says so rather than guessing.
- Industry
- Mining — diamonds
- Target users
- Management at Trans Hex’s Baken mine and, from version two, other operations in the group
- GEMIS’s role
- Stabilised the company’s in-house information system, automated the SAP data feed and built the reporting into it
- Scope
- System stabilisation, scheduled SAP financial data integration, integrated management reporting with budget-against-actual, exports, forecasts and variances
- Timeframe
- 2017, with version two following
- Status
- Delivered 2017; a second version followed
- Key deliverables
- The company’s own management information system running reliably; A daily SAP financial data import — scheduled, de-duplicated, logged, with failure emails to the team; An integrated management report across plant, mining, finance, security and HR: gravel treated, carats, fleet availability and cost per carat, for the month and year to date; Filters by mine, period and date range; export to Excel and PDF; Version two: weekly figures, forecasts, variances, live exchange rates and mine groups
The business challenge
From a weeks-long report to one click
Baken mine: SAP data feed automated and an integrated management report built in.
Trans Hex has mined diamonds for more than fifty years. At its Baken mine on the Lower Orange River, management needed one clear view across plant, mining, finance, security and people.
That view was pieced together in Excel from several sources, including SAP. It took weeks to assemble, errors crept in along the way, and by the time it was ready the month had moved on.
The constraint was that the data already existed in systems the mine depended on; the problem was getting it into one reliable, repeatable report.
Discovery and evidence
What the design was based on
Only the evidence that exists is described here. Nothing is labelled research that was not.
The record holds no research report for this project. The brief was management’s own: one clear view across plant, mining, finance, security and people at the Baken mine, in place of a report pieced together in Excel from several sources over weeks, with errors creeping in.
The constraint was that the data already existed in systems the mine depended on — SAP among them — so the problem was getting it into one reliable, repeatable report.
Strategy and system structure
Why this approach fits the problem
- Make the foundation reliable before adding to it
- Automate the feed, with failure made visible
- Build the report into the system, not beside it
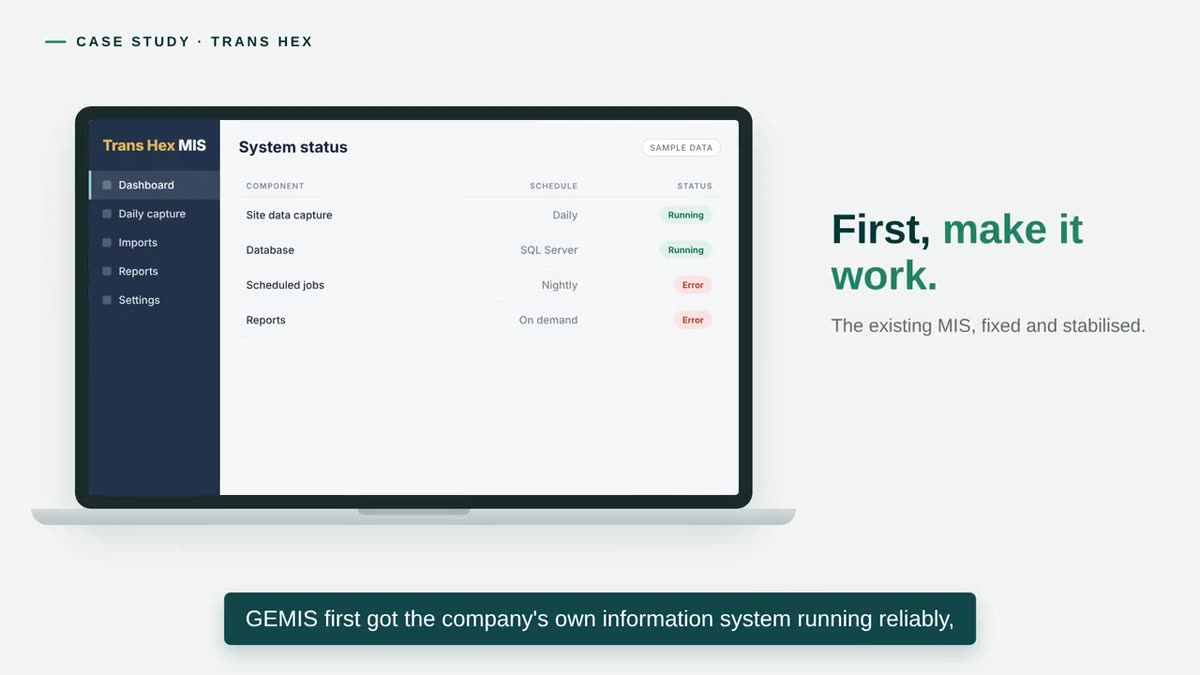
GEMIS first got the company’s own information system running reliably, so that nothing new was built on an unstable base.
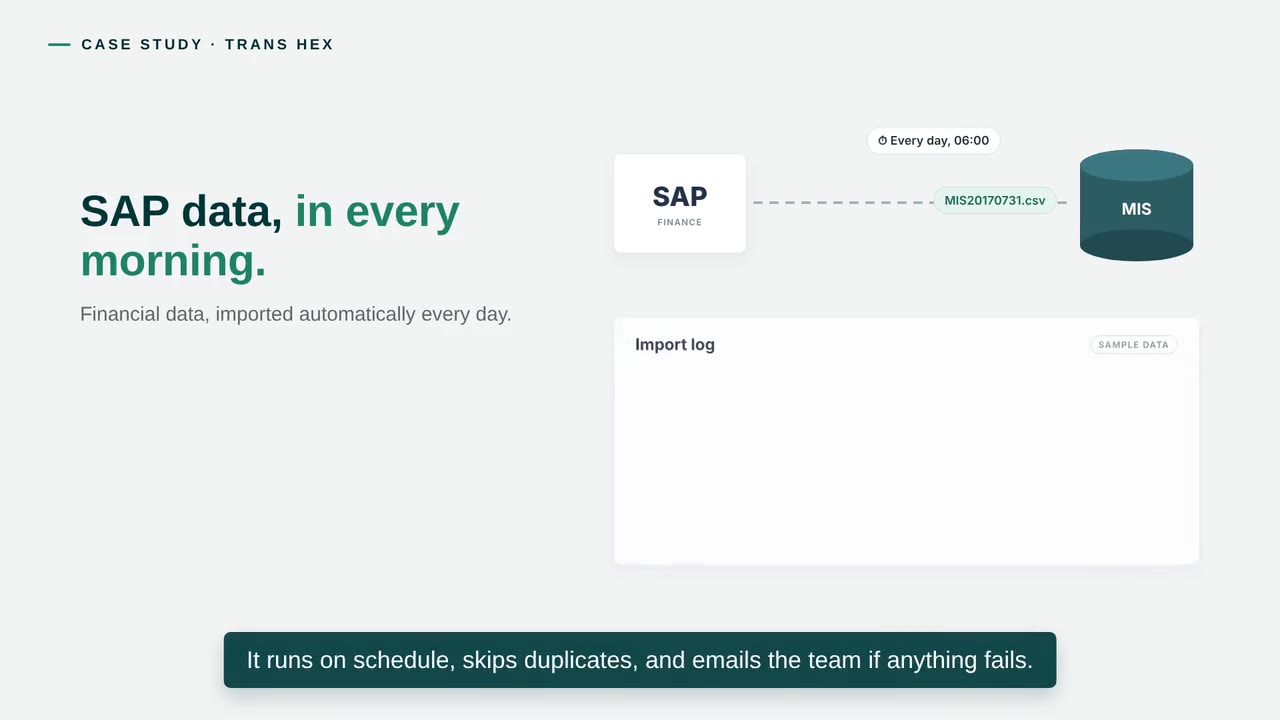
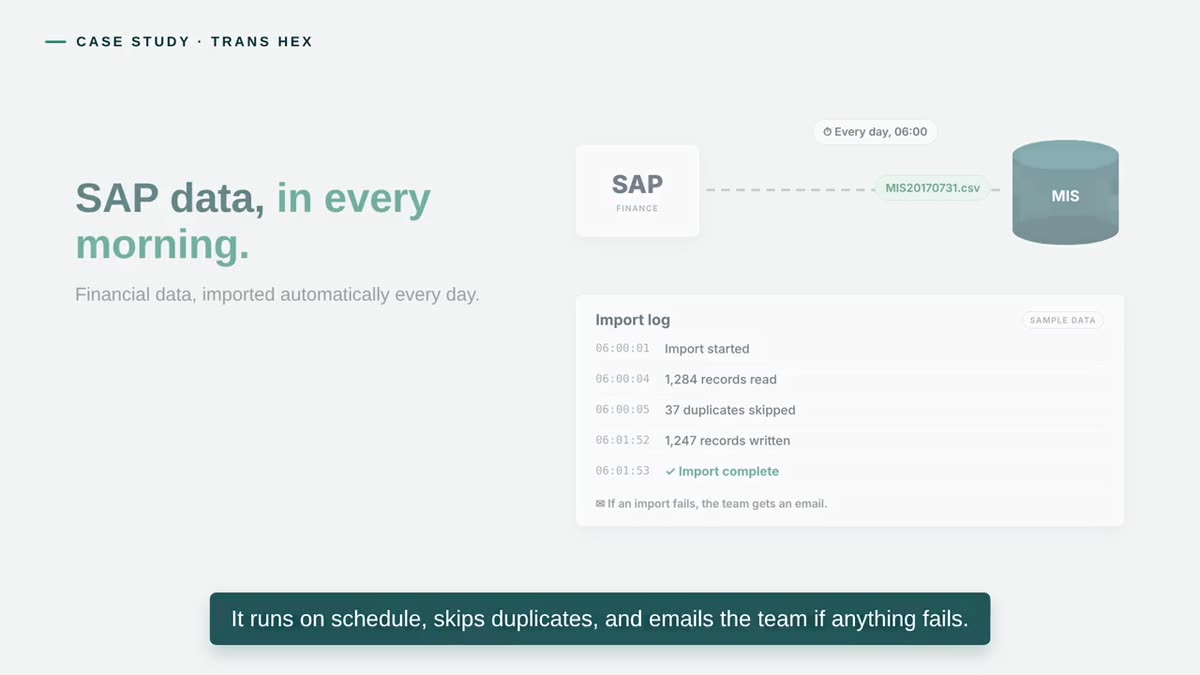
The daily feed of financial data from SAP was then automated: it runs on schedule, skips duplicates, logs what it did, and emails the team if anything fails — so a missing day is noticed, not discovered at month-end.
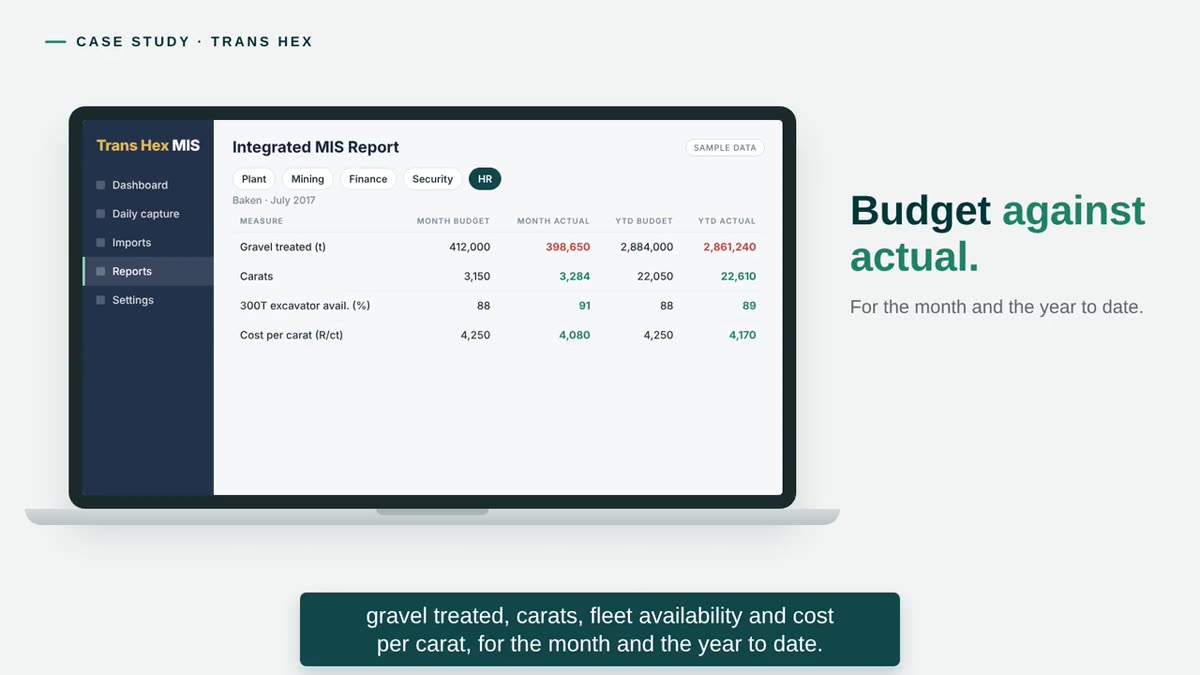
The management report was built into the system itself rather than assembled outside it, with budget against actual for the month and the year to date, filters by mine and period, and export to Excel and PDF. Version two extended the same structure with weekly figures, forecasts, variances, live exchange rates and mine groups, bringing other operations into the same view.
In 2017 GEMIS stabilised Trans Hex's in-house management information system at the Baken diamond mine, automated the daily SAP financial data import (scheduled, de-duplicated, logged, with failure emails), and built an integrated management report covering plant, mining, finance, security and HR: budget against actual for month and year to date, filterable by mine and period, exportable to Excel and PDF. Version two added weekly figures, forecasts, variances, live exchange rates and mine groups. A report that took weeks became available on demand.
Read the transcript
Trans Hex has mined diamonds for more than 50 years. In 2017, GEMIS worked with its Baken mine on the Lower Orange River. Management needed one clear view: plant, mining, finance, security and people. But that view was pieced together in Excel from several sources. It took weeks, and errors crept in. GEMIS first got the company's own information system running reliably, then automated the daily feed of financial data from SAP. It runs on schedule, skips duplicates, and emails the team if anything fails. Then GEMIS built the management report into the system itself: gravel treated, carats, fleet availability and cost per carat, for the month and the year to date. Filter by mine, period or date range, and export to Excel or PDF. Version two added weekly figures, forecasts, variances and live exchange rates, and brought other operations into the same view. A report that took weeks, now ready whenever it was needed. Built by GEMIS.
The workflow as implemented
- SAP Financial data in the systems the mine already runs on
- Daily feed Scheduled; duplicates skipped; every run logged
- Failure email The team is told if anything fails — a missing day is noticed
- The company MIS Stabilised first, then holds the imported data
- Integrated report Plant, mining, finance, security and HR; budget against actual
- Version two Weekly figures, forecasts, variances, exchange rates, mine groups
The system, step by step
What the user needs to do, and how the system supports it
Stills from the case study video. The interfaces are illustrated for the video, not screen recordings of the production system; every capability shown is one the system delivers.
-
Illustrated in the case study video First, make it work
GEMIS first got the company’s own information system running reliably, so nothing new was built on an unstable base.
-
Illustrated in the case study video SAP data, in every morning
The daily feed of financial data from SAP runs on schedule, skips duplicates, logs what it did, and emails the team if anything fails.
-
Illustrated in the case study video Budget against actual
Gravel treated, carats, fleet availability and cost per carat, for the month and the year to date, built into the system itself.
-
Illustrated in the case study video Any mine. Any period.
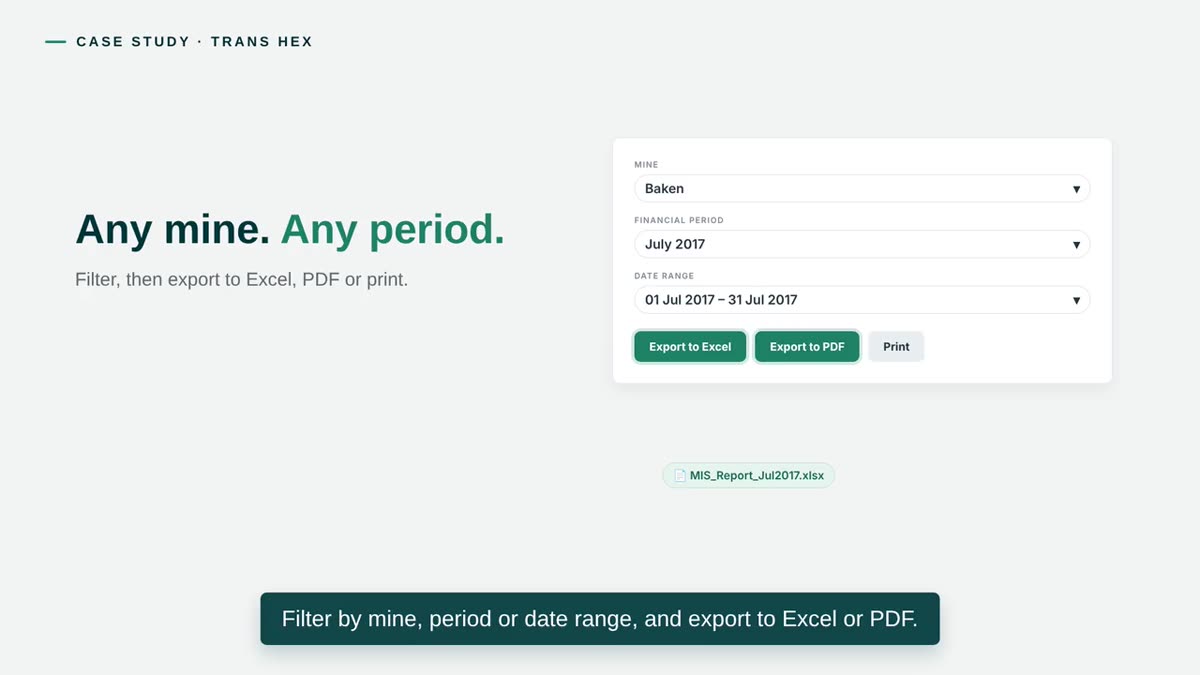
Filter by mine, period or date range, then export to Excel or PDF.
-
Illustrated in the case study video Weekly. Forecast. Variance.
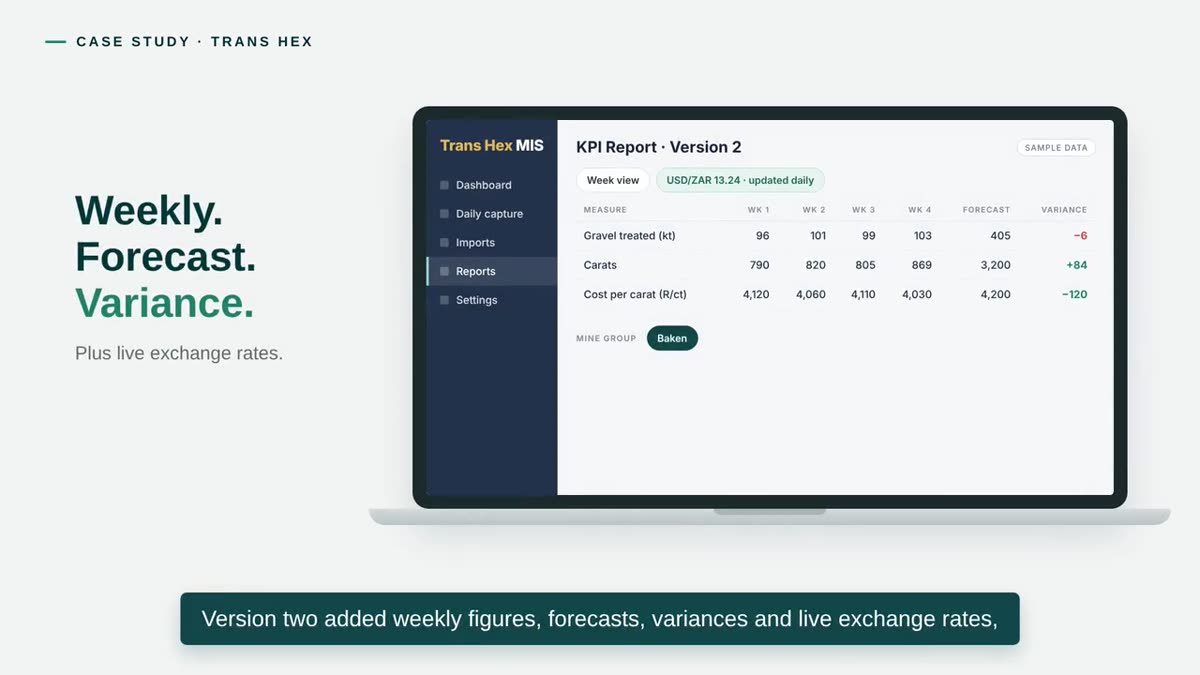
Version two added weekly figures, forecasts, variances and live exchange rates.
-
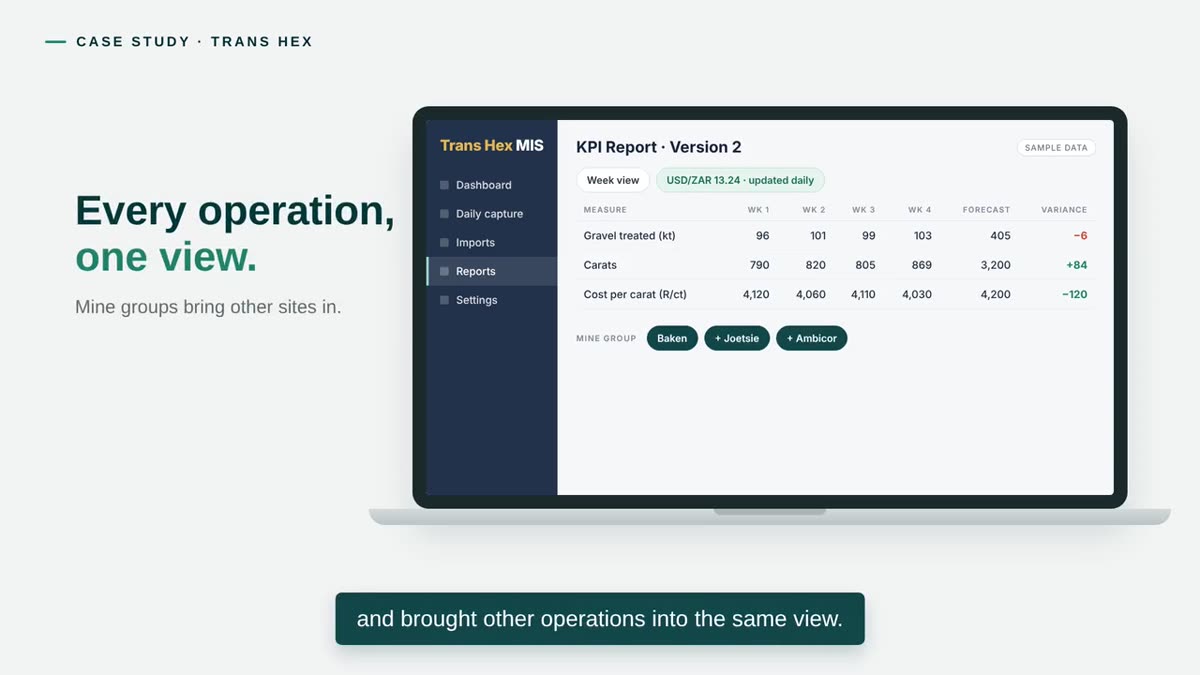
Illustrated in the case study video Every operation, one view
Mine groups brought other operations into the same report.
Key decisions
Why it was built this way
The decisions the evidence supports: what needed addressing, what GEMIS chose, why, and what was delivered or observed.
-
- Challenge
- The existing information system was not reliable enough to build on.
- Decision
- Stabilise the company’s own system before adding anything to it.
- Rationale
- A report is only as trustworthy as the system that holds its data; fixing the foundation first avoided building errors in.
- Evidence or effect
- Delivered, as shown in the case study.
-
- Challenge
- Financial data was re-keyed from SAP into spreadsheets, and errors crept in.
- Decision
- Automate a daily SAP feed that runs on schedule, skips duplicates and logs every run.
- Rationale
- Loading the data once, automatically, removes the manual copy that introduced the errors.
- Evidence or effect
- Delivered, as shown in the case study.
-
- Challenge
- A silent failure in an automated feed would only be discovered at month-end.
- Decision
- Email the team if any run fails.
- Rationale
- Automation that fails loudly is safer than automation that fails quietly; a missing day is noticed the same morning.
- Evidence or effect
- Delivered, as shown in the case study.
-
- Challenge
- The management report lived outside the system, assembled by hand.
- Decision
- Build the report into the system, with filters by mine and period and export to Excel and PDF.
- Rationale
- A report generated from the system is repeatable and current; one assembled beside it is neither.
- Evidence or effect
- A report that took weeks became available whenever it was needed (as stated in the case study); version two extended the same structure.
Validation, delivery and iteration
What the record shows
Delivery and continued use are the validation the repository can evidence. What it cannot, it says.
On record
- Delivered in 2017 (facts.md).
- A second version followed, adding weekly figures, forecasts, variances, live exchange rates and mine groups — evidence that the first version was used and extended.
Not documented
- Time-saving figures beyond the case study’s own statement, and user-acceptance records, are not in the repository, so none are claimed.
Outcomes and business value
A report that took weeks became available on demand
Delivered work, verified results and intended benefits are kept apart. Nothing here is a metric the client has not confirmed.
Delivered
- A stabilised in-house information system
- An automated, monitored SAP financial feed
- An integrated management report with filters, exports and a second version of extended measures
Verified results
- A report that took weeks became available whenever it was needed (as stated in the case study)
Intended benefits
- Fewer errors, because the data is loaded once and checked automatically
- Management decisions on current figures rather than last month’s
- One view across operations rather than one spreadsheet per source
Built on SAP integration · SQL · reporting
Related work
Two projects that share the pattern
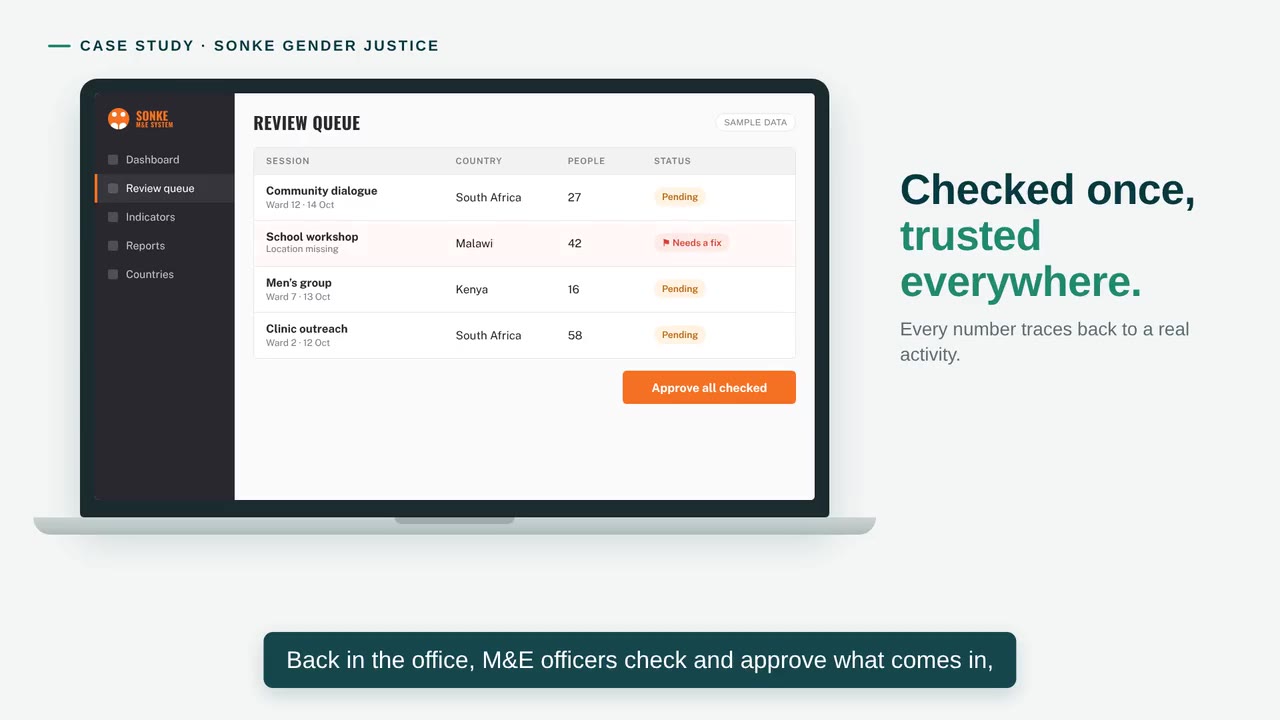
Non-profit — gender-based violence and HIV prevention
Sonke Gender Justice
Monitoring and evaluation across Africa
- Field operations
- Integration
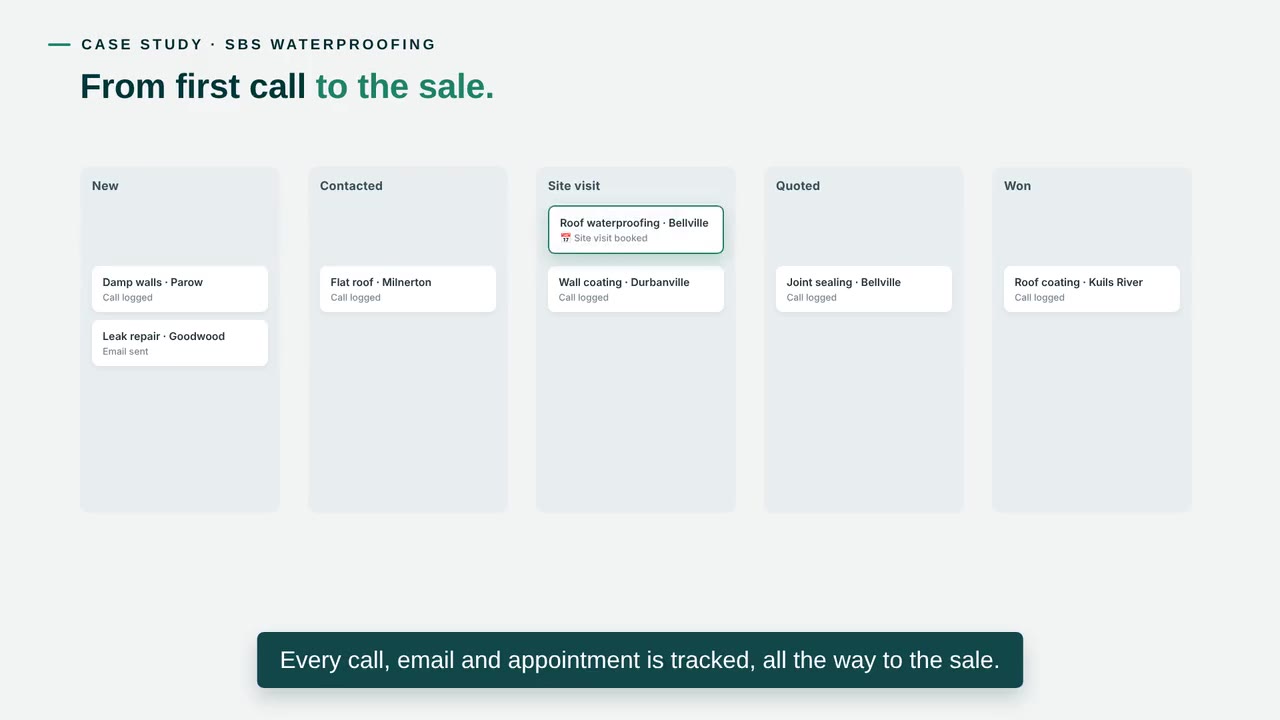
Construction services — waterproofing and roofing
SBS Waterproofing
The system behind more than a decade of growth
- Platforms
Next steps
Compiling the management pack by hand from several systems? Let’s talk about an automated, integrated report.
Tell us what the business needs to do better. We come back within two working days with a short written view and a time to talk — no obligation.